|
|
|
|
|
|
|
|
|
|
|
| |
|
2017 |
|
2018 |
|
2019 |
|
2020 |
|
2021 |
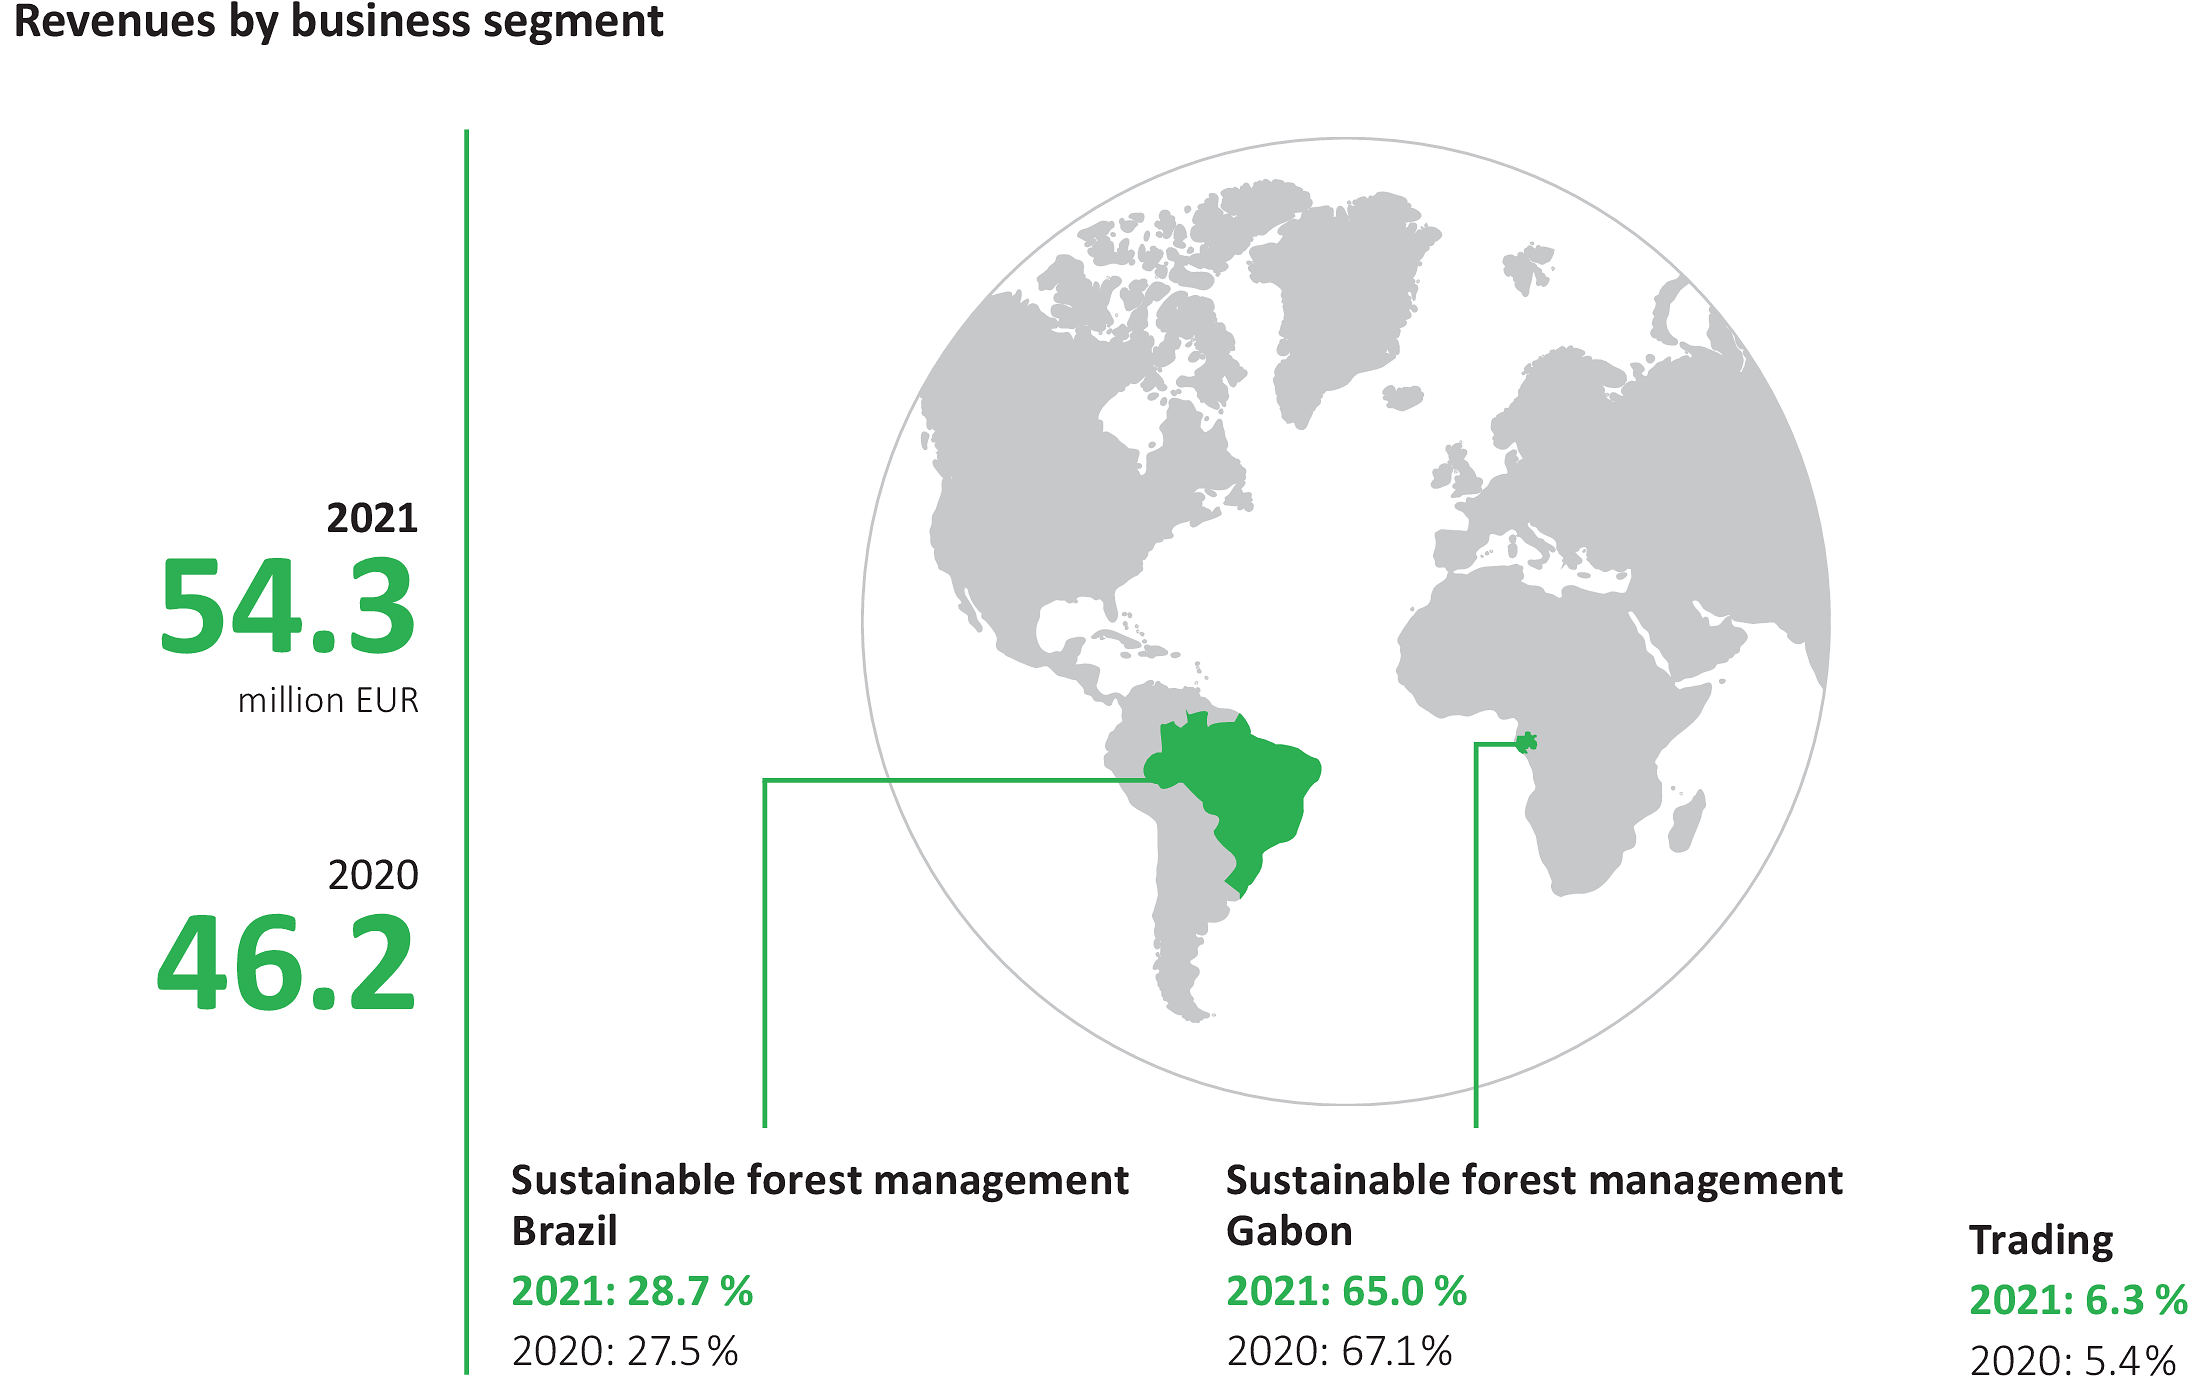
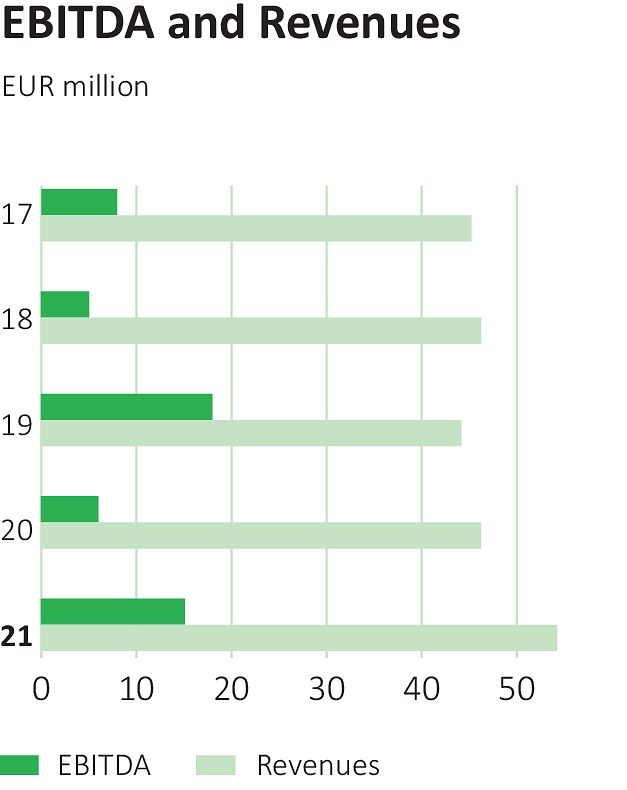
| Revenues |
|
44 997 |
|
46 349 |
|
44 380 |
|
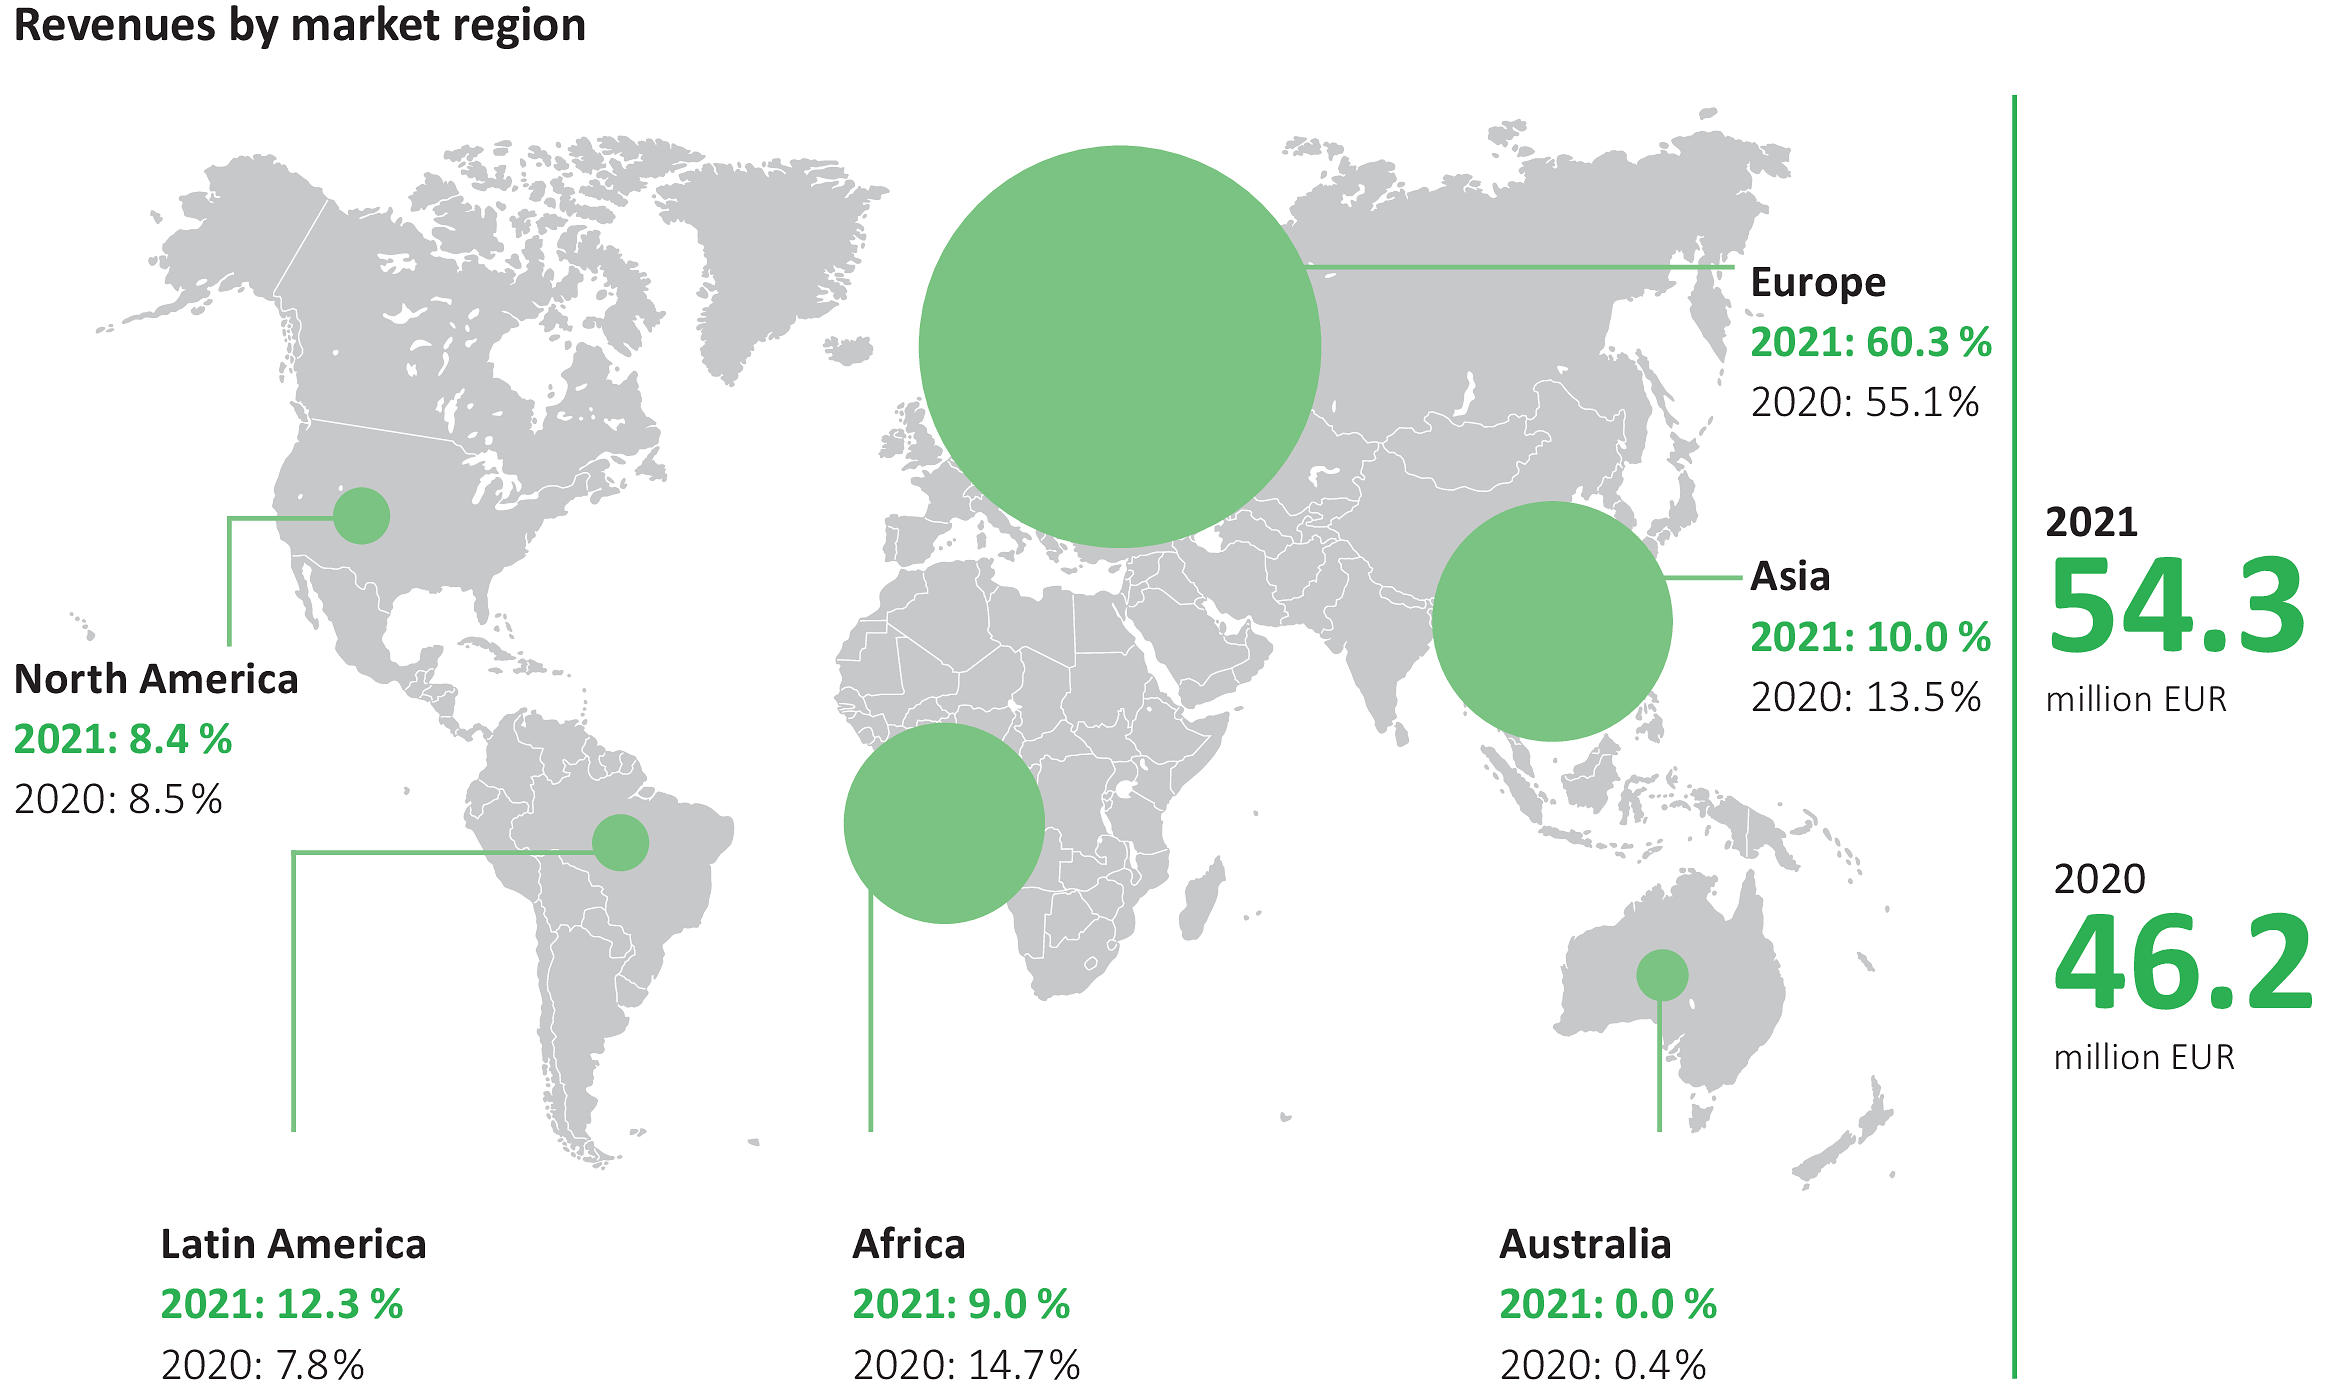
46 186 |
|
54 299 |
| Depreciation, amortization and impairments |
|
4 681 |
|
3 416 |
|
4 494 |
|
3 882 |
|
4 329 |
| Depreciation and amortisation |
|
4 699 |
|
3 435 |
|
2 239 |
|
3 922 |
|
4 317 |
| Impairments |
|
–18 |
|
–19 |
|
635 |
|
–40 |
|
12 |
| EBITDA |
|
8 210 |
|
5 111 |
|
18 450 |
|
5 769 |
|
15 066 |
| in % of revenues |
|
18.2% |
|
11.0% |
|
41.6% |
|
12.5% |
|
27.7% |
| EBIT |
|
3 529 |
|
1 695 |
|
13 956 |
|
1 887 |
|
10 737 |
| in % of revenues |
|
7.8% |
|
3.7% |
|
31.4% |
|
4.1% |
|
19.8% |
| Net result |
|
1 643 |
|
–1 717 |
|
7 973 |
|
–2 181 |
|
4 686 |
| in % of revenues |
|
3.7% |
|
–3.7% |
|
18.0% |
|
–4.7% |
|
8.6% |
| Balance sheet total |
|
71 405 |
|
73 435 |
|
131 076 |
|
109 443 |
|
117 438 |
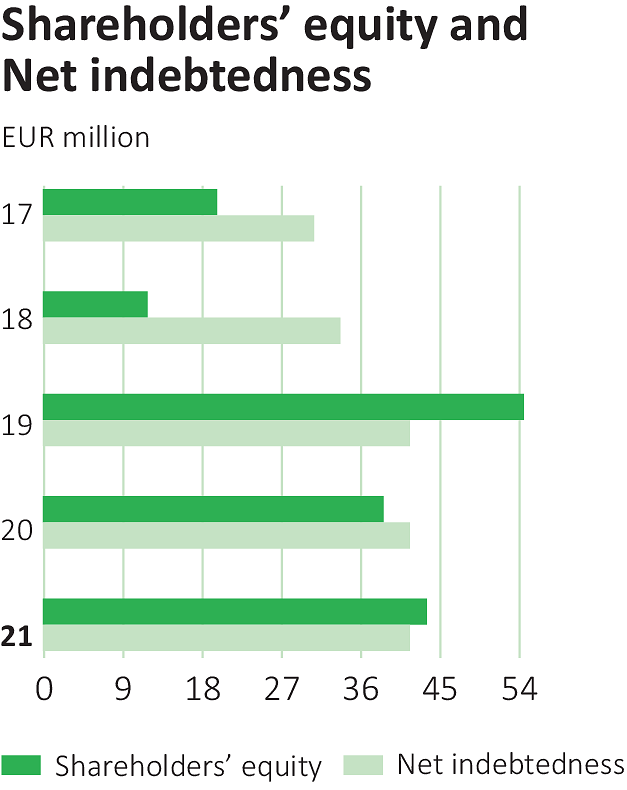
| Shareholders' equity |
|
20 095 |
|
11 614 |
|
55 104 |
|
39 309 |
|
44 438 |
| in % of the balance sheet total |
|
28.1% |
|
15.8% |
|
42.0% |
|
35.9% |
|
37.8% |
| Net indebtedness |
|
31 283 |
|
34 441 |
|
41 631 |
|
41 910 |
|
42 184 |
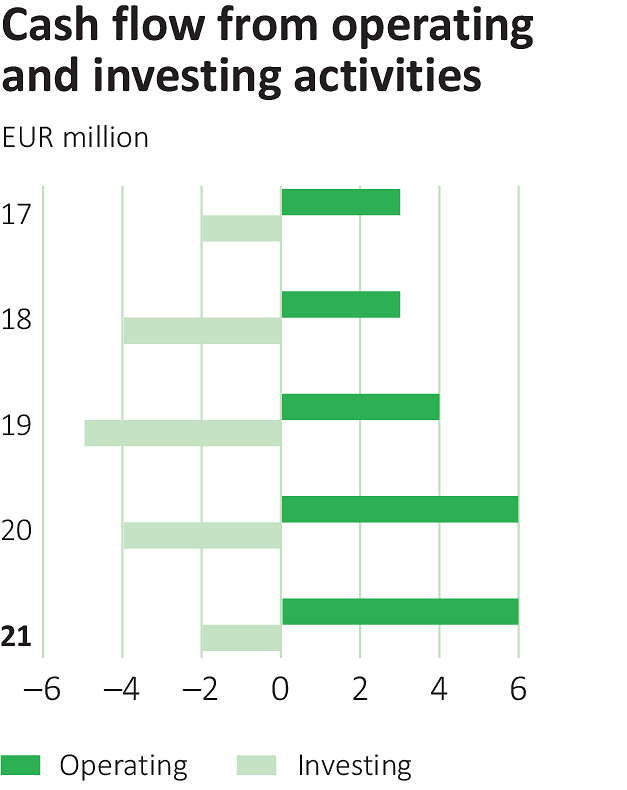
| Cash flow from operating activities |
|
3 351 |
|
3 307 |
|
3 806 |
|
5 868 |
|
6 049 |
| Investments/acquisitions |
|
–2 244 |
|
–3 542 |
|
–4 650 |
|
–4 038 |
|
–2 332 |
| Average full-time-equivalent employee |
|
1 340 |
|
1 408 |
|
1 498 |
|
1 548 |
|
1 540 |